
Crypto markets move fast. Prices can swing dramatically within minutes, and traders rely on charts to make informed decisions. Among the most powerful tools in technical analysis is the candlestick chart.
Learning how to read candlestick charts helps you understand market sentiment, spot trends, and identify potential entry and exit points with greater confidence.
What Is a Candlestick Chart?
A candlestick chart is a visual representation of price movements over a specific period. Each candlestick displays four key data points:
- Open price
- Close price
- High price
- Low price
These charts originated in Japanese rice trading centuries ago and are now standard in cryptocurrency and financial markets.
Anatomy of a Candlestick
Each candlestick consists of two main parts:
1. The Body
The thick section shows the range between the opening and closing prices.
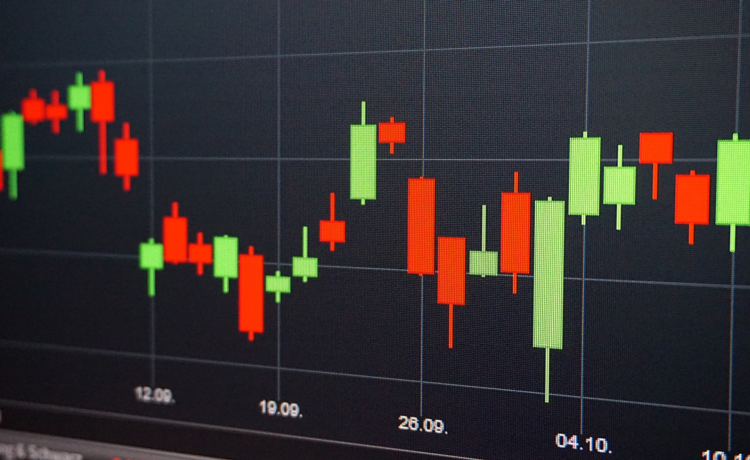
- If the close is higher than the open, the candle is typically green (bullish).
- If the close is lower than the open, the candle is typically red (bearish).
2. The Wicks (Shadows)
The thin lines above and below the body represent:
- Upper wick – The highest price reached
- Lower wick – The lowest price reached
Long wicks often signal strong buying or selling pressure.
Understanding Timeframes
Candlesticks reflect price movement within a chosen timeframe.
Common timeframes include:
- 1 minute
- 5 minutes
- 1 hour
- 4 hours
- 1 day
Short timeframes show rapid fluctuations, while longer timeframes reveal broader trends. Professional traders often analyze multiple timeframes before making decisions.
Bullish vs. Bearish Candles
Bullish Candles
Indicate buying pressure.
- Close higher than open
- Often signal upward momentum
Bearish Candles
Indicate selling pressure.
- Close lower than open
- Often signal downward momentum
However, a single candle rarely tells the full story. Context matters.
Essential Candlestick Patterns
Patterns emerge when multiple candles form recognizable shapes. These patterns can signal potential reversals or trend continuation.
1. Doji
A Doji forms when the open and close prices are nearly equal.
- Indicates market indecision
- Often appears before a trend reversal
2. Hammer
A candle with a small body and long lower wick.
- Appears after a downtrend
- Signals potential bullish reversal
3. Shooting Star
Small body with a long upper wick.
- Appears after an uptrend
- Signals potential bearish reversal
4. Engulfing Pattern
Occurs when one candle completely engulfs the previous candle’s body.
- Bullish engulfing signals upward reversal
- Bearish engulfing signals downward reversal
Recognizing these patterns improves timing accuracy.
Identifying Trends
Candlestick charts help identify three primary market trends:
- Uptrend – Higher highs and higher lows
- Downtrend – Lower highs and lower lows
- Sideways trend – Price moves within a range
Trend direction is crucial. Trading against the trend increases risk.
Support and Resistance Levels
Candlestick charts become more powerful when combined with support and resistance analysis.
- Support – A price level where buying pressure tends to increase
- Resistance – A price level where selling pressure tends to increase
When patterns form near these levels, signals become stronger.
Volume Confirmation
Volume measures how much cryptocurrency is traded during a period.
High volume during a breakout strengthens the move. Low volume may indicate weak momentum.
Professional traders rarely rely on candlestick patterns alone; they confirm signals with volume data.
Risk Management
Even experienced traders face losses. Proper risk management is essential.
Best practices include:
- Setting stop-loss orders
- Avoiding emotional trading
- Risking only a small percentage of capital per trade
- Using risk-to-reward ratios
Charts provide probability, not certainty.
Common Mistakes Beginners Make
- Overtrading based on single candles
- Ignoring larger timeframe trends
- Trading without stop-loss protection
- Relying solely on patterns without context
- Letting emotions override analysis
Mastery comes from disciplined practice and consistent review.
Combining Candlesticks With Indicators
Professional traders often combine candlestick analysis with indicators such as:
- Moving averages
- Relative Strength Index (RSI)
- MACD
- Bollinger Bands
These tools provide additional confirmation and reduce false signals.
FAQ: How to Read Crypto Candlestick Charts Like a Pro
1. Are candlestick patterns always accurate?
No. They provide probability-based signals, not guarantees. Confirmation from other indicators improves reliability.
2. What is the best timeframe for beginners?
Many beginners start with 1-hour or 4-hour charts to reduce noise and avoid excessive volatility.
3. Can candlestick charts predict exact prices?
They help identify potential trends and reversals but cannot predict exact future prices.
4. How many patterns should I learn first?
Focus on a few core patterns like Doji, Hammer, and Engulfing before exploring advanced formations.
5. Do candlestick patterns work in all market conditions?
They are more reliable in trending markets and near strong support or resistance zones.
6. Is technical analysis enough for crypto trading?
No. Market news, fundamentals, and overall sentiment also influence crypto prices.
7. How long does it take to master chart reading?
Skill development varies by individual, but consistent practice and real-time market observation are key.
Reading crypto candlestick charts is both analytical and interpretive. With structured learning, practice, and disciplined risk management, traders can turn chart data into informed decision-making tools rather than guesswork.